
Going back over the last 50 years, the average return of the S&P 500 has been about 10%. However, the annual total return has only fallen inside of a range of +/- 2% of the average (8-12%) three times. When looking at bonds, which are typically thought of as a more reliable return stream, annual returns only came within the +/-2% range of the average 12 times. There were a handful of times when both came close to the annual averages in the same year, but there was only one year when stocks and bonds were both in the +/-2% range.
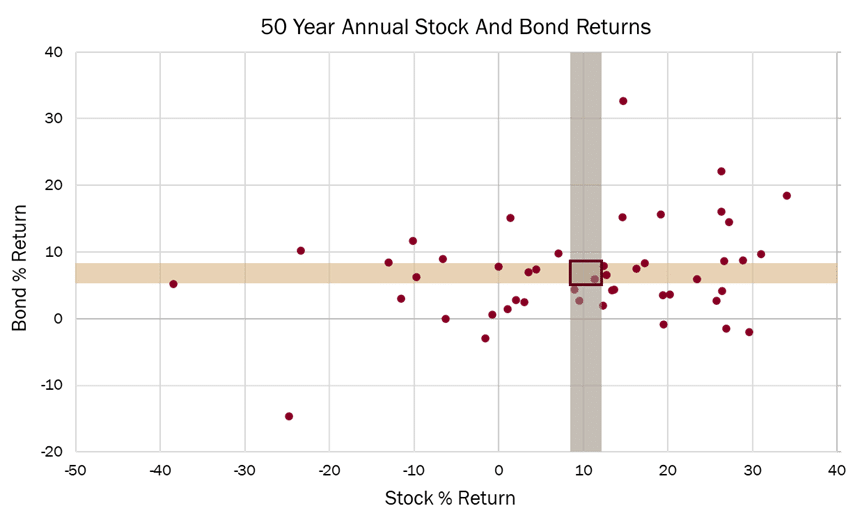
Source: FactSet as of 12-31-22. Past performance is not indicative of future results.
As the Fed continues to battle inflation aggressively and the full impact of the rate hikes is still working through the economy, we believe it is important for investors to remember that there will always be bumps along the road of investing. This applies to bull and bear markets and whether we are in a recession or in an expansion. The market is always looking ahead, and it is natural that the market will therefore have more volatility because daily, weekly, and monthly up and down moves are tied to whether economic or market data met or did not meet investors’ expectations at a certain point in time. The markets are rarely a reflection of what is happening today but are more often a reflection of what investors believe about tomorrow, next month, next quarter, and even next year. We believe the best path along that road is to create and follow a financial plan that can allow investors to keep perspective during those inevitable bumps, and to take advantage of opportunities as they present themselves over time.
One of the most important factors leading to achieving long-term returns is time in the market. An investor must be invested for the long term to achieve long-term results – that seems obvious, but it is a key lesson that many investors forget as they try to time the market to only experience the good years! As shown in the prior chart, investors rarely achieve the average returns in any given year. The chart below illustrates that the market is much more volatile when looking at shorter time periods (red dots represent intra-year declines and gray bars are full year returns). Even in the short term, market corrections and negative periods do not always equal negative years for the U.S. stock market by the time the year is over.
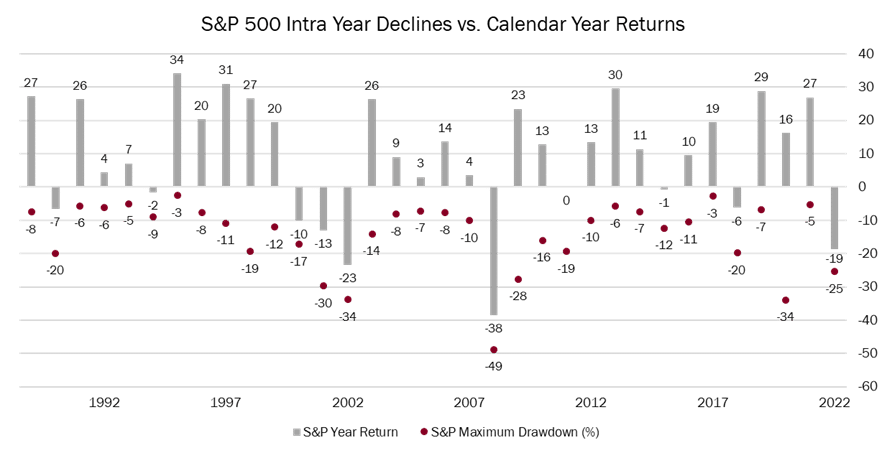
Source: FactSet as of 11-4-22. Past performance is not indicative of future results.
Trying to successfully time the market means investors must make two correct decisions: when to get out of the market and when to get back in, or vice versa. It is often “easier” to get out than it is to get back in, as markets tend to start recovering long before economic or psychological conditions make investors comfortable getting back into the market. History tells us that missing out on the market’s best days has been shown to reduce performance over time.
Although returns are never guaranteed, history indicates that by staying invested longer investors can receive better returns. In looking at 1-year, 5-year, 10-year, and 20-year S&P 500 historical rolling returns, the market teaches us that anything can happen in one year (there are more red bars in the first row), but as we extend our investment horizon from the short term to the longer term, the odds of better outcomes and positive returns are increased over time as shown in the 10-year and 20-year rolling periods.
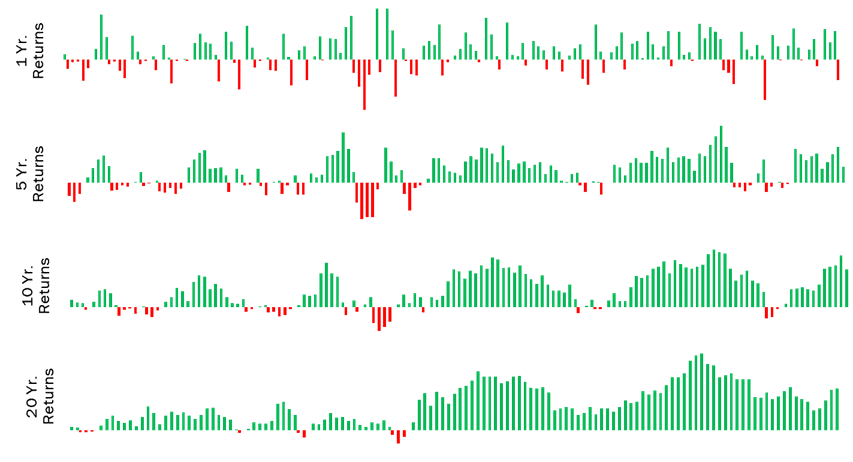
Source: FactSet as of 12-31-22. Past performance is not indicative of future results.
Overall, we believe time in the market is more important than timing the market, and we believe that building a portfolio strategy that helps you stay invested is key to achieving success. Building good habits and creating a financial plan that sets boundaries to remove some of our natural emotional responses that may derail our best intentions is crucial for investors’ long-term performance.
If you have any questions or would like to discuss further, please reach out to your client service team or call 404.264.1400.
Important Disclosures
This article may not be copied, reproduced, or distributed without Homrich Berg’s prior written consent.
The information reflects Homrich Berg’s views, opinions, and analyses as of April 30, 2023. Past performance is not a guarantee or indicator of future results. Inherent in any investment is the potential for loss. This commentary is for informational purposes only and should not be considered legal, tax, accounting, or investment advice. Views and opinions expressed herein are as of the date posted unless indicated otherwise, with no obligation to update. Certain information herein has been obtained from third party sources believed to be reliable but has not been independently verified. Discussions pertaining to potential future events and their impact on the markets are based on current expectations and analysis. Actual results may vary.
©2023 Homrich Berg